Infographics:
Content Marketing Statistics for 2017 – Blog & Email Marketing
- Senior Designer
With the longest day last month signalling our half-way point of the year, it’s time to wrap-up this series of Content Marketing Statistics for 2017. This final instalment is focused on Blog and Email Marketing.
Blog
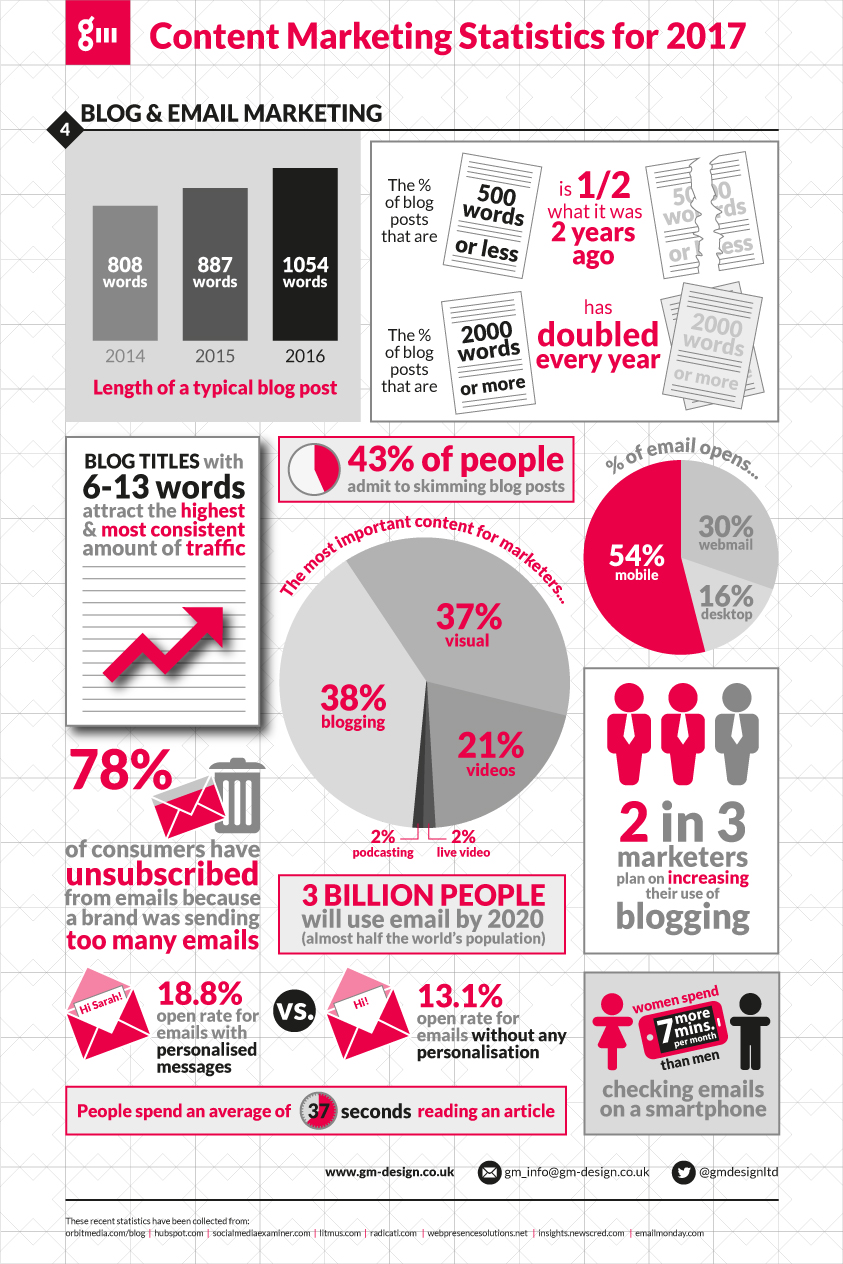
It seems that the art of blogging is far from dying, with 2 in 3 marketers planning on increasing their use of blogging. Blog posts have seen changes in recent years. The length of a typical blog post has been steadily rising, from an average of 808 words in 2014 to an average of 1054 words in 2016. The percentage of long-form blog posts (of 2000 words or more) has doubled every year since 2014, whereas the percentage of short-form blog posts (of 500 words of less) is half what it was two years ago. Even though blog posts are getting longer, the evidence doesn’t suggest that all of this content is being properly digested, as 43% of people admit to skimming blog posts. People spend an average of 37 seconds reading an article, so this clearly can’t equate to reading a full 2000 words.
Email Marketing
3 billion people will use email by 2020, which is almost half the world’s population. Email is therefore fair game for marketers, but too many will alienate your audience. 78% of consumers have unsubscribed from emails because a brand was sending too many. Getting your emails read is the battle for marketers. Personalising your marketing message might have an effect on whether it’s read or not. Personalised messages achieve an 18.8% open rate whereas emails without any personalisation achieve a 13.1% open rate. Also, knowing what platform your emails are likely to be read on may inform the way they are designed and formatted. 54% of email opens are now on mobile devices, 30% via webmail, and only 16% on the old favourite, desktop. Interestingly, women spend 7 more minutes per month than men checking emails on a smartphone.
If you’d like a reminder of the past stats in this series, you can view and save the full infographic here. In the meantime, good luck with your content marketing for the rest of 2017!
What to Read Next...
By submitting a Contact Form enquiry, you confirm you have read our Privacy Policy.
"*" indicates required fields
Latest News
Interested in joining our team?
If you are an experienced Content Marketing Manager, we'd love to hear from you. You will be an extremely valued team player in our service delivery, working directly with our high-profile client base. Our approach is very much quality over quantity as we strive to deliver the best service possible.
Apply now and create a fresh start for yourself within our growing business.