Infographics:
What Makes a Successful Infographic?
- Senior Designer
What is an infographic?
An infographic is a visual representation of data, using text and images to tell a story. Information is simplified to make complicated facts and figures easier to understand and digest.
How to create a successful infographic
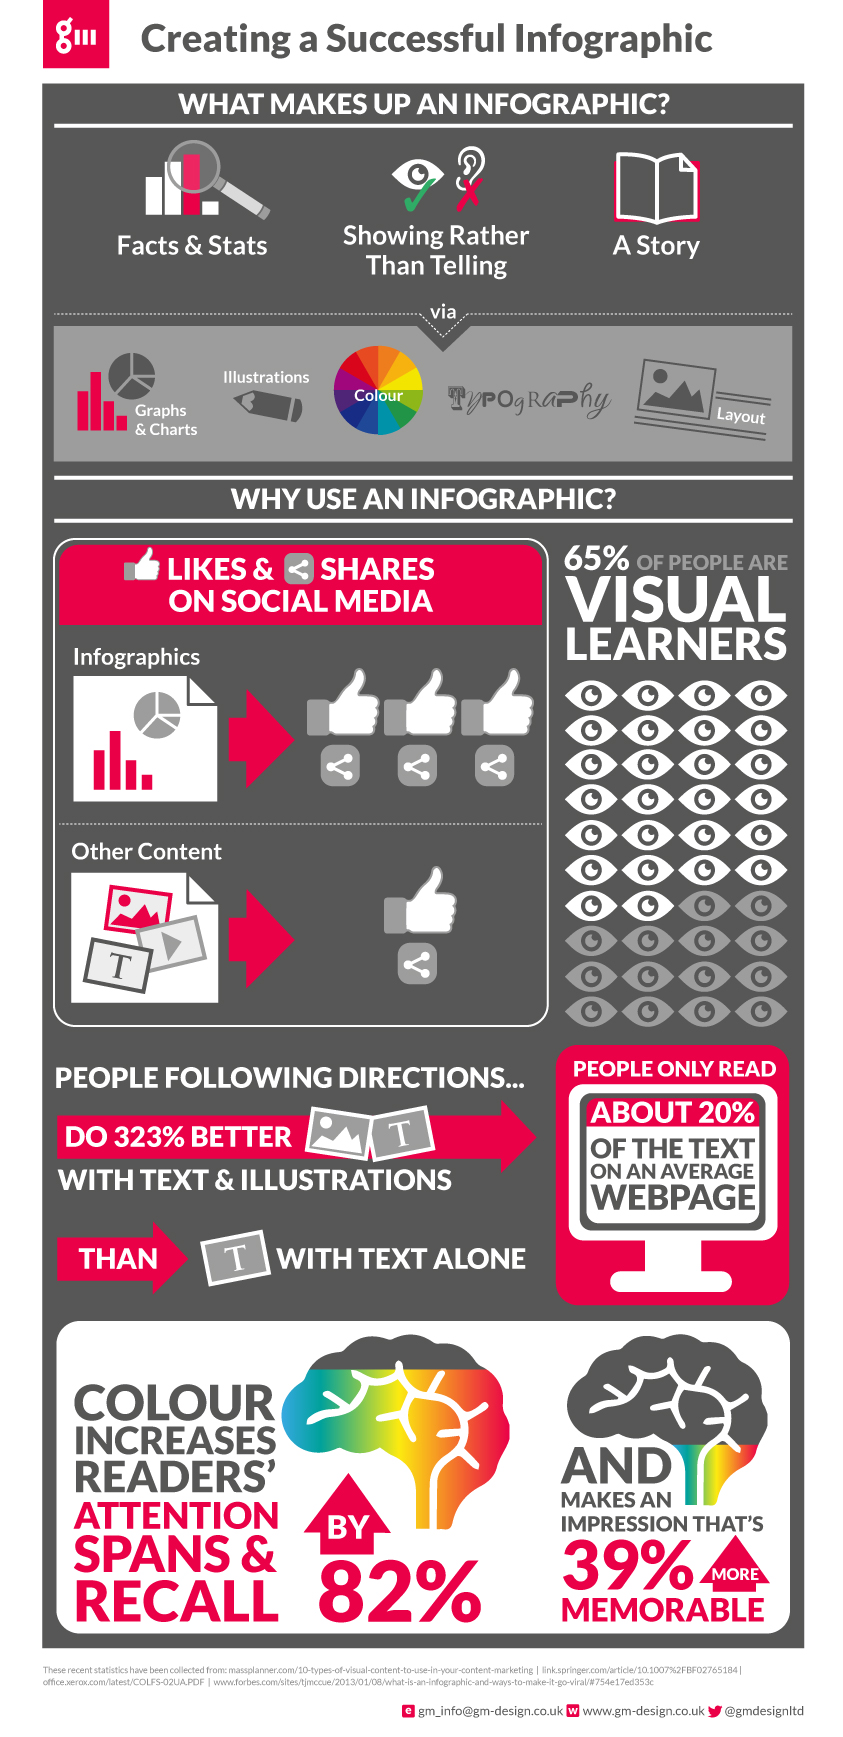
A successful infographic, as the name suggests, is all about information. The key thing to remember is to show rather than tell. Most of us understand complicated facts much better if they are demonstrated visually rather than just written. Illustrations are more immediate, and this is why road signs usually feature simple illustrations or icons rather than written sentences.
Charts and tables are good ways to illustrate statistics, as the comparison between the different items are much more instant for the viewer to see. The more bespoke the style of charts and tables are, the more your infographic will stand out from others, which may have been created using online tools.
Typography and illustration can make or break your infographic. Typography should be clear and legible, rather than overly decorative or abstract. Text is important to help communicate the information, but it shouldn’t be more dominant than the graphics themselves. If you are concentrating on decoration and lose sight of the main purpose of an infographic – communicating the information clearly – then you won’t really end up with an infographic. That said, the best infographics are creative and have a well-designed concept that tells a story. As with all design, the most successful pieces achieve their purpose, while also looking attractive and communicating an idea.
Wireframing and storyboarding before designing anything will ensure that your infographic achieves what you were aiming for and fits together in the most logical and attractive way. This also saves time, as properly planned out work avoids many time-consuming changes down the track.
What are the benefits to your business of using an infographic?
Infographics are liked and shared on social media three times more than any other types of content. This is obviously great news for your business, because your information is reaching a wider audience and subsequently your company is gaining all that valuable extra exposure.
What to Read Next...
By submitting a Contact Form enquiry, you confirm you have read our Privacy Policy.
"*" indicates required fields
Latest News
Interested in joining our team?
If you are an experienced Content Marketing Manager, we'd love to hear from you. You will be an extremely valued team player in our service delivery, working directly with our high-profile client base. Our approach is very much quality over quantity as we strive to deliver the best service possible.
Apply now and create a fresh start for yourself within our growing business.